Instacart Grocery Online Store

Purpose and Context
During one of my courses at CareerFoundry, I had a project that introduced me to the world of Python. This project was key because it allowed me to apply my analytical skills for performing exploratory analysis in a very big dataset.
Objective
Analyzing sales patterns, performing exploratory analysis, and deriving insights for a better segmentation for an online grocery store, Instacart. The company is interested in understanding the purchase behavior from their customers, so they could deliver better targeted marketing campaigns. My role as Data Analyst is to give a recommendation.
Goal
Deliver a final report including tables and visualizations that profile Instacart customers based on their purchase behaviors.
Tools, Skills, Methodologies
Python and relevant libraries (pandas, NumPy, matplotlib, scipy, and seaborn).
View the ProjectFirst step- Cleaning Data
As a first step I needed to clean the datasets. As with any project, avoiding this step might lead into weird or misleading results in your analysis. Python is surprisingly good at doing this job and is incredibly fast. This step consisted in cleaning 3 data sets (orders, customers and products) was straightforward and it followed the classic methodology of ensuring data is in a consistent format, there are no unexplained missing values, and there are no duplicated records.
Second step- Merging Data
This is where things start turning interesting. Once I merged the datasets, I was left with a unified version of almost 30M rows and 30 columns! Quite a lot when it is your first time trying to handle this massive amount of data. To give you a brief idea, this dataset contained information in the orders each user had done, the time and date of purchase, the product’s name, the department the product belong to, and demographic information from customers (age, income, state, family status, number of dependants).
Third Step- Segmenting Customers
From this step on is where I understood why pandas (the library of Python I used for this project) is a better option when dealing with big datasets. Normally, in programing languages when trying to categorize something, you need to evaluate logical conditions and iterate these conditions to every row in the dataset. Doing this is the same as trying to apply a formula to numerous cells in Excel and your computer screen freezes. Thanks to the magical loc function I was able to segment Instacart customers into 15 different profiles based on family status, age, income, and number of dependents.
Final Step - Analyzing and Visualizing
This final stage of the process is where I extracted most of my future learnings and practices from Python. Analyzing the data is all about grouping variables and applying a statistical criterion. For instance, finding out the average spending or the count of orders made by each of the 15 profiles I had suggested in the step before.
When are orders placed?
The analysis shows evidence that weekend orders are the busiest, while it is slowest on Tuesdays and Wednesdays.
Most orders are placed during work hours between 10 am to 4 pm. After 4pm, the order volume decreases.
Which are top-selling categories?
The five most popular departments are produce, dairy/eggs, snacks, beverages, and frozen items.
Produce departments have twice as many orders as dairy/eggs.
Preference types of products reflects distribution of customer profile.
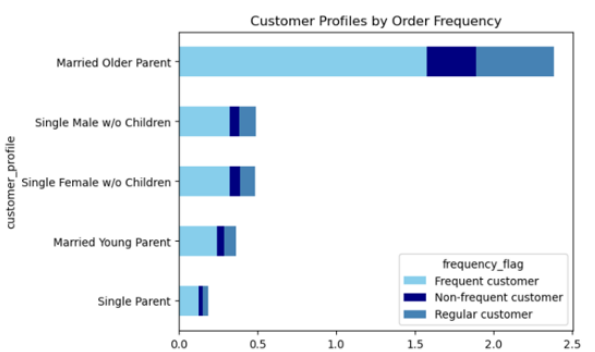
What is ordering habits of different customer profiles?
Middle income married older parent profile far exceeds other income profile groups
Upper income married older parent group is 2nd largest order frequency
Customer income profile with least orders are upper income single parents
Across all customer profiles, majority of customers are frequent customers
Small number of customers are labeled as non-frequent customer group
Recommendations and Findings