CitiBike Analysis
Motivation
Citi Bike is the official bike share program in New York City. Like Lyft Bikes, Citi Bikes can be unlocked from one station and returned to any station in the system. We want to figure out which routes and times are best for CitiBikes traffic
Business Questions
1. What are busiest days for CitiBike?
2. What times of the day people use Citi Bike most frequently?
3. What age groups use Citi Bike the most?
4. Which stations are busiest or least busiest?
5. What factors impact trip duration in particular like time of day or day of week?
Context
Citibike is a bike rental company in NYC looking to improve bike rental ridership. The objective is to analyze when rides occur most frequently and find most prevalent bike stations.
Dataset
The database used for this project can be found in the following
link.
Limitations
The data set was acquired for only one month period when Citi Bike started. Data could be more valuable over a longer period of time.
1. Data Exploration

A) Which hours of day or days of week are busiest for CitiBike?
The busiest days for Citi Bike rides are Monday, and then Friday
The least busy days are Saturday and Sunday
The busiest hour for CitiBike is 5:00 PM
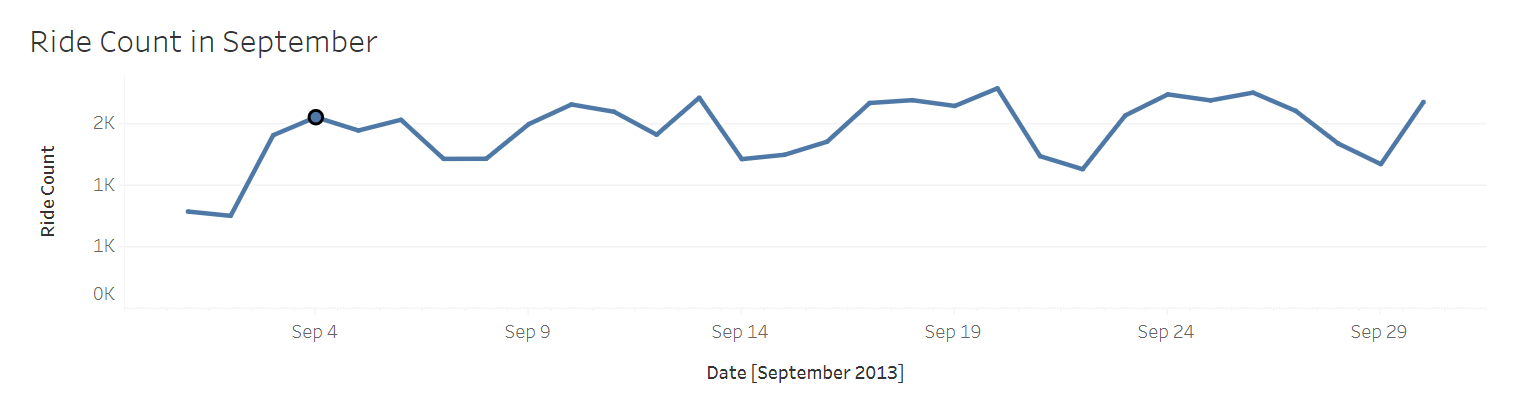
Over the course of the month, there is increased ride count trend during weekdays and decreasing trend during weekend
B) How does age impact ridership of Citi Bikes?
Most riders are born in the 1980s
The trip duration slightly decreases as riders are younger except for Gen Zs
Younger people tend to ride Citi Bikes in the weekend
There is trend of younger average rider age in early morning and nighttime in particular.
2. Linear Regression Analysis
Hypothesis
When more rides occur, the longer the ride duration will be
There is strong negative trend between ride count and trip duration, there is enough trend line to see if they are directly to each other.
However, there is only a slight positive trend between trip duration and hour of the day.
However, many data points are not close enough to trendline in both charts, which makes it hard to determine if these factors impact trip duration.
3. Cluster Analysis

Following the Linear Regression analysis, a cluster analysis was also applied.
You can see that in busier time periods, average rides trend shorter.
However, in less busy time periods, there is greater range of length of ride. Overall, as ride count increase the ride times tend to decrease.
4. Station Analysis
Where do most City Bike Trips take place?

The Busiest Start station is Pershing Square N. with 475 rides in September.
The Busiest End Station is E 17th St & Broadway 495 with in September.
The busiest start stations are Pershing Square N, Lafayette St & E 8th St, W 20th & 11th Ave, and E 17th St & Broadway.
The busiest end stations are E 17th & Broadway, W 20th St & 11th Ave, 8th Ave & W 31st St, and Lafayette St & E 8th St.
5. Conclusion & Recommendations

6. Reflections


